- Want to understand how the frequency response of a transistor works?
- Why does the gain drop at high frequencies? And why does it also drop at low frequencies in amplifier circuits?
- How can you improve the frequency response of a transistor or amplifier?
This article will answer these questions.
I have been studying and working with electronic circuits for nearly 10 years.
One important characteristic of BJTs is that their behavior changes as the signal frequency increases.
Do you know what causes this change?
After reading this article, you will clearly understand the causes of the frequency response drop and how to improve it.
You will learn which frequency range a transistor can operate in, and how to improve its frequency response.
These concepts will become clear as you go through the explanations.
It takes only about 3 minutes to read — enjoy!
What Is the BJT Frequency Response?
The frequency response of a transistor generally refers to the frequency dependence of hFE.
If you are not familiar with hFE, it is the current gain of a BJT in a common-emitter configuration.
Transistors are often used as amplifying devices to increase small input signals.
In other words, even a small input current can be amplified into a much larger output current.
For example, if hFE = 100, the transistor can provide a current gain of 100 times.
If you want to learn more about hFE, please refer to the article below.
Reference: What Is Transistor hFE? Measurement, Variations, and Temperature Characteristics
Now, let’s get back to the frequency response of BJTs.
When we plot the frequency response of a transistor, the graph looks like this:
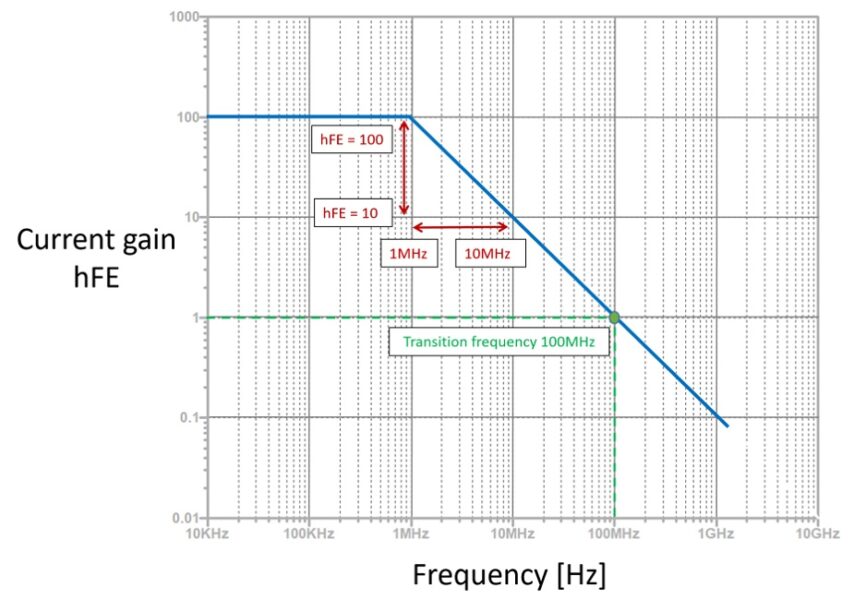
As shown above, the gain remains nearly constant up to around 1 MHz, and then hFE gradually decreases as the frequency increases.
The horizontal axis represents the frequency of the signal applied to the base (B) of the transistor.
In the region where hFE starts to fall, there is a clear characteristic.
When the frequency doubles, hFE becomes half.
This means that hFE is inversely proportional to frequency.
For example, when the frequency increases by a factor of 10, hFE decreases to about 1/10.
For instance:
Frequency ×10: 1 MHz → 10 MHz
Current gain hFE ×1/10: 100 → 10
This is how the graph should be interpreted.
As the frequency continues to increase, hFE becomes smaller and eventually reaches a value of 1.
This frequency is known as the transition frequency (fT).
In the graph above, the point where hFE = 1 is around 100 MHz, which represents the transition frequency.
Above this transition frequency, hFE becomes less than 1.
At that point, the transistor can no longer amplify the input signal, and the signal instead begins to attenuate.
Therefore, to use a transistor as an amplifier, the operating frequency must remain in a region where hFE is greater than 1.
In practice, this means using the transistor below its transition frequency.
From the graph, we can interpret the usable frequency range like this:
To achieve a gain of 100× (hFE = 100)
→ Use input signals below 1 MHz
To achieve a gain of 10× to 100× (10 ≤ hFE ≤ 100)
→ Use input signals below 10 MHz
To achieve a gain of 1× to 10× (1 ≤ hFE ≤ 10)
→ Use input signals below 100 MHz
This is how you can estimate the practical operating range.
However, many transistor datasheets do not include a detailed hFE-versus-frequency graph.
Instead, they typically list only the transition frequency fT.
When designing circuits, use the transition frequency as your guideline.
A good rule of thumb is to operate the transistor at about 1/5 to 1/10 of its fT.
Why Does the BJT Frequency Response Drop at High Frequencies? (And How to Improve It)
So why does the graph show that
Higher frequency → Lower hFE
in the first place?
The reason is that a transistor has an internal resistance and an internal capacitance between the base and emitter.
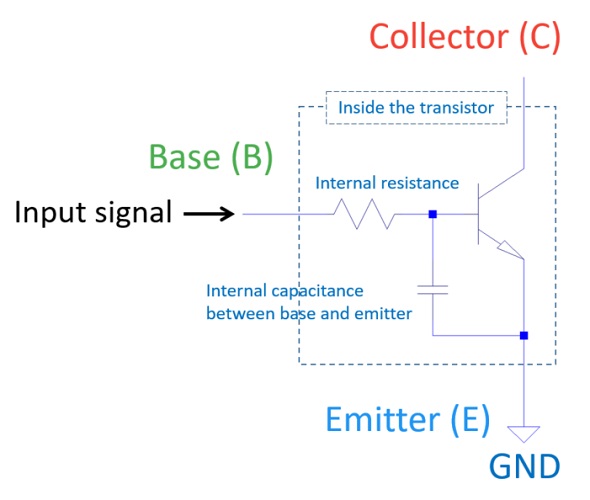
These internal components act like a low-pass filter to the input signal.
FAQ: How Can I Amplify Frequencies Higher Than the Transition Frequency?
The answer is simple: use a transistor with a higher transition frequency (fT).
For example:
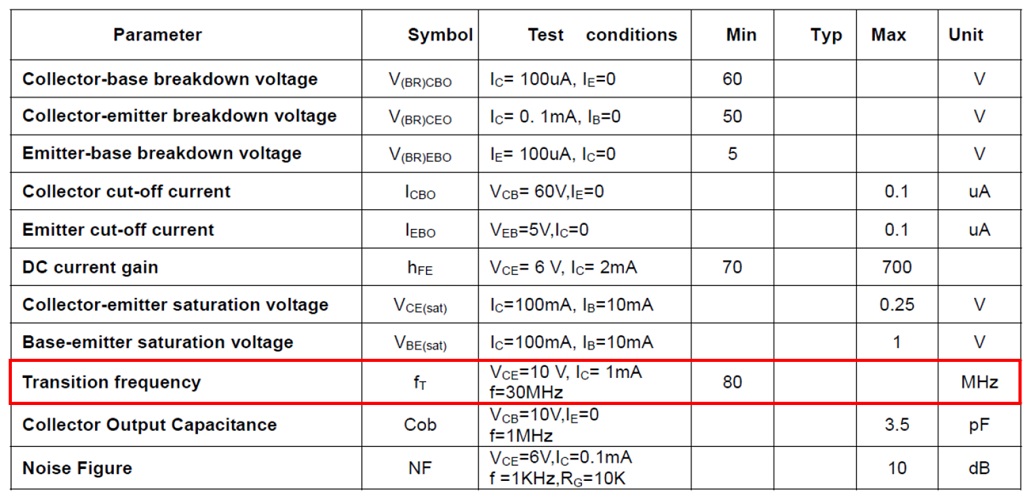
【2SC1815】
【2SC1906】
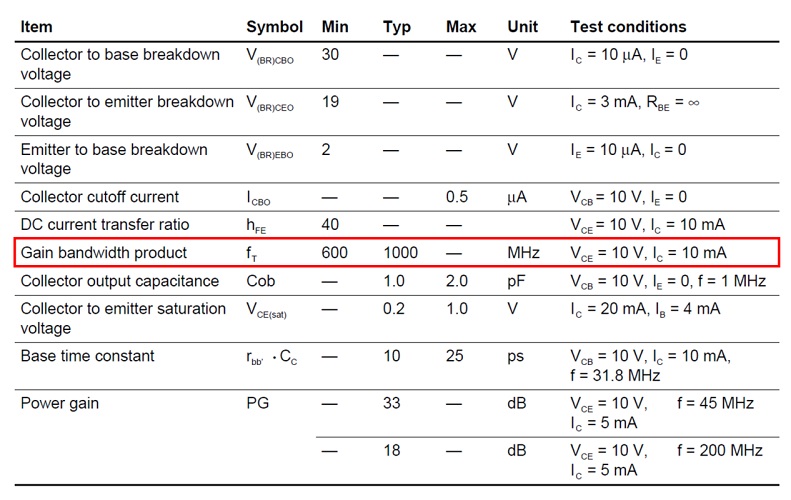
Excerpt from the Hitachi 2SC1906 datasheet
When you switch from the 2SC1815 to the 2SC1906, the transition frequency increases dramatically from 80 MHz to 600 MHz.
This allows you to amplify signals at much higher frequencies.
Note: The Transition Frequency Depends on Collector Current
The transition frequency changes with collector current.
Here is an example from the Toshiba 2SC1815 datasheet:
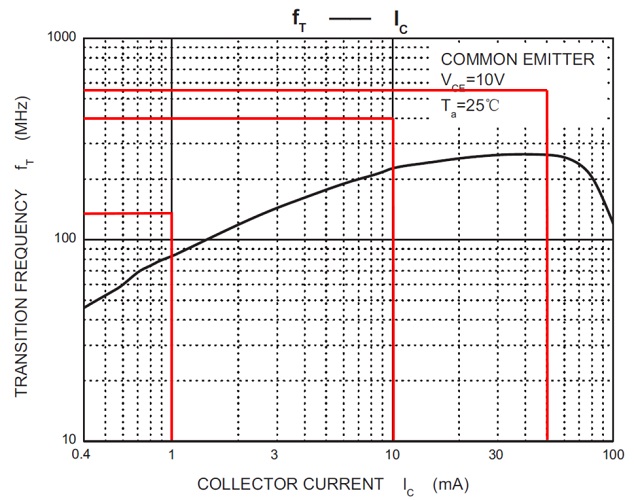
Collector current 1 mA
→ Transition frequency 150 MHz
Collector current 10 mA
→ Transition frequency 400 MHz
Collector current 50 mA
→ Transition frequency 550 MHz
As you can see, the transition frequency varies significantly with collector current.
You may think the transistor can amplify up to 550 MHz, but if the collector current is only 1 mA, the usable limit is around 150 MHz…
So always keep this in mind when designing high-frequency circuits.
Why the Frequency Response of a Transistor Amplifier Drops at Low and High Frequencies
Up to this point, we’ve discussed the frequency response of a transistor on its own.
Now, let’s look at what happens when the transistor is used as part of an amplifier circuit. The overall frequency response changes as shown below.
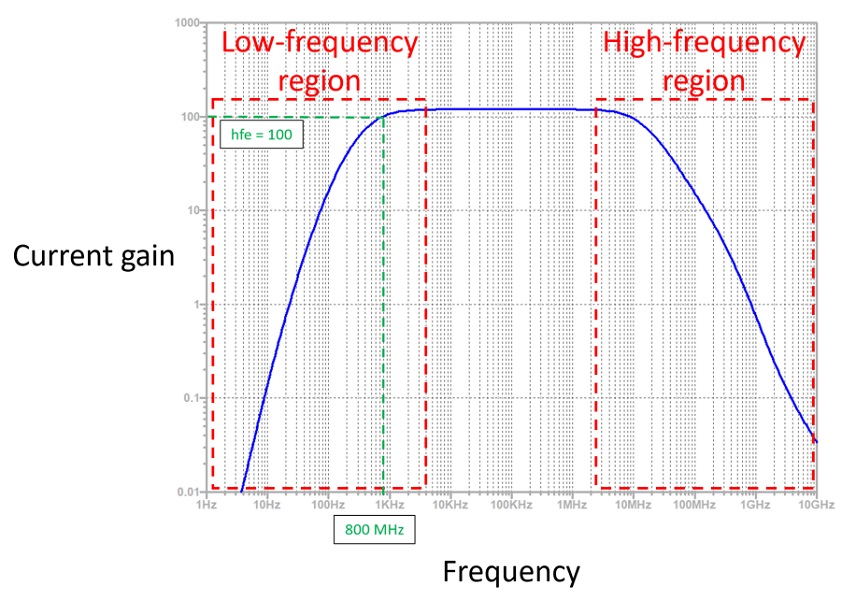
A key feature is that the gain (hfe) also decreases in the low-frequency region, not only in the high-frequency region.
If we look only at the transistor itself, low frequencies would normally be amplified. However, when used in a real amplifier, other components influence the overall response.
As a result, the gain falls at low frequencies as well, giving the response a “trapezoid-like” shape.
The main reason for this low-frequency drop is the coupling capacitors.
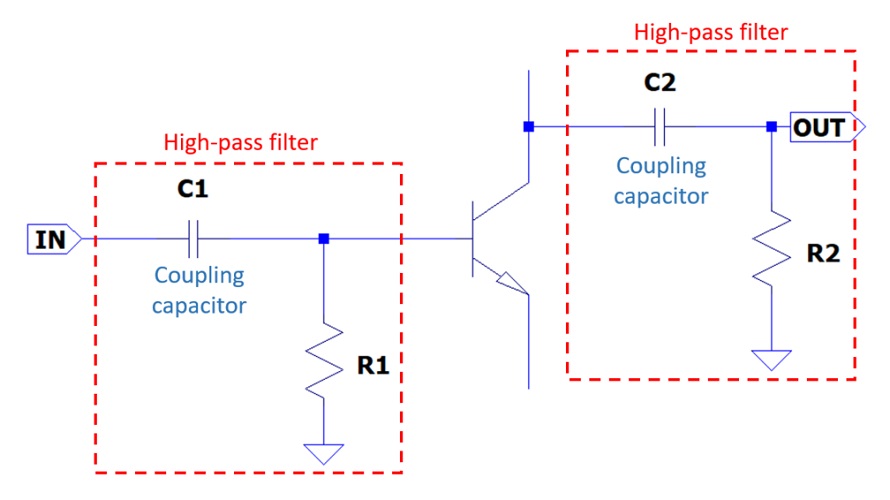
Coupling capacitors are placed at the input and output of the amplifier stage.
These capacitors form a high-pass filter, causing the gain to drop at low frequencies.
To improve the low-frequency response, you can simply increase the capacitor values.
In the graph above, the coupling capacitors C1 and C2 are 0.1µF.
At this value, the frequency at which hfe = 100 is roughly 800 MHz.
Now, let’s change C1 and C2 from 0.1 µF to 1 µF.
The resulting frequency response looks like this:
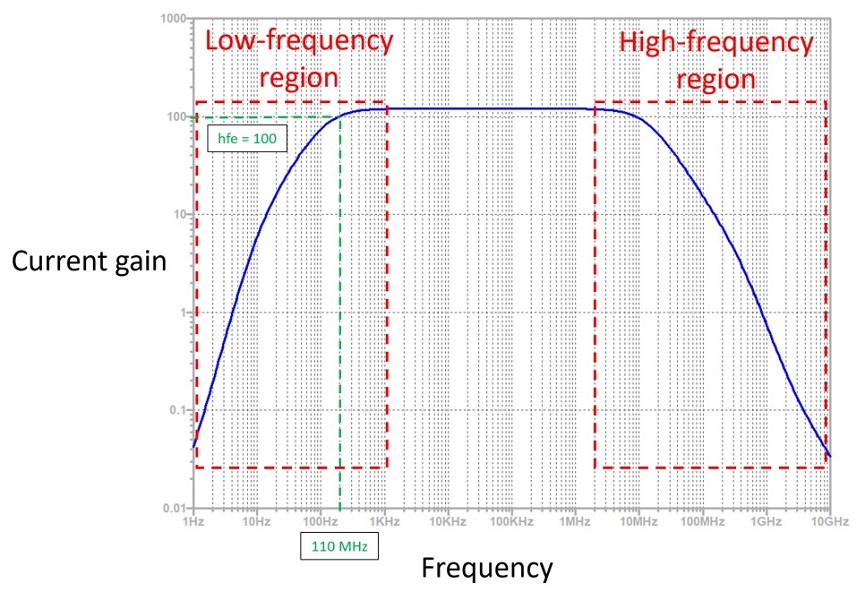
With the larger capacitors, the frequency where hfe = 100 shifts to around 110 MHz.
This shows that the amplifier can now handle lower frequencies more effectively.
Therefore, increasing the coupling capacitor values is a simple and effective way to improve low-frequency performance.
Additional Note: The Miller Effect Reduces High-Frequency Gain
Earlier in this article, we saw that a transistor’s internal characteristics cause the gain to decrease at high frequencies.
In an amplifier circuit, this reduction is even more noticeable. The reason is the Miller effect.
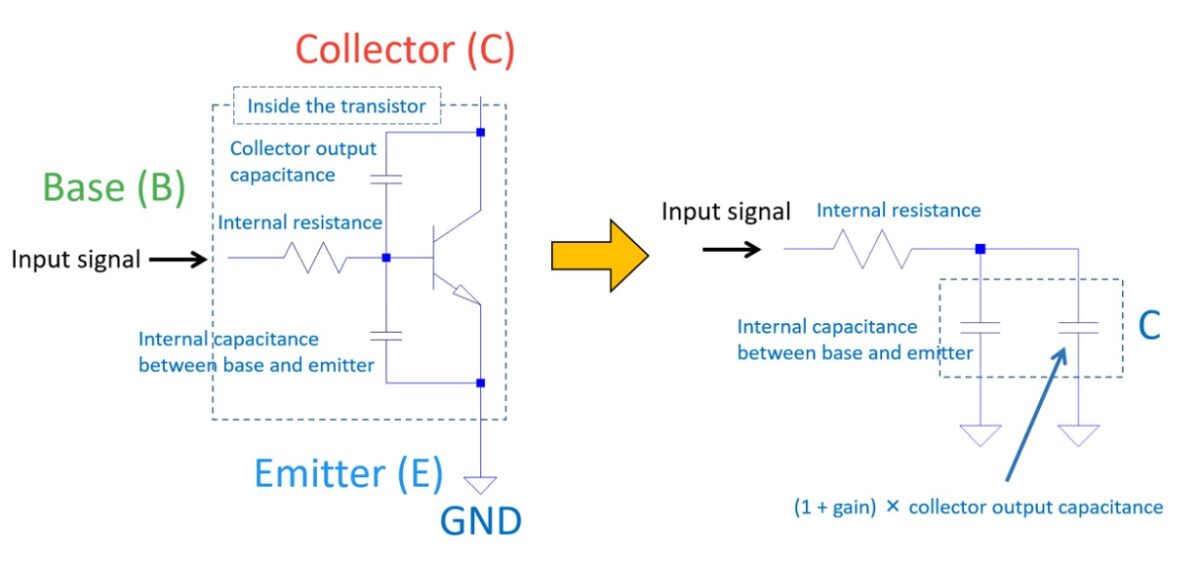
In a standalone transistor, the internal resistance and base–emitter capacitance form a low-pass filter, reducing hfe as frequency increases.
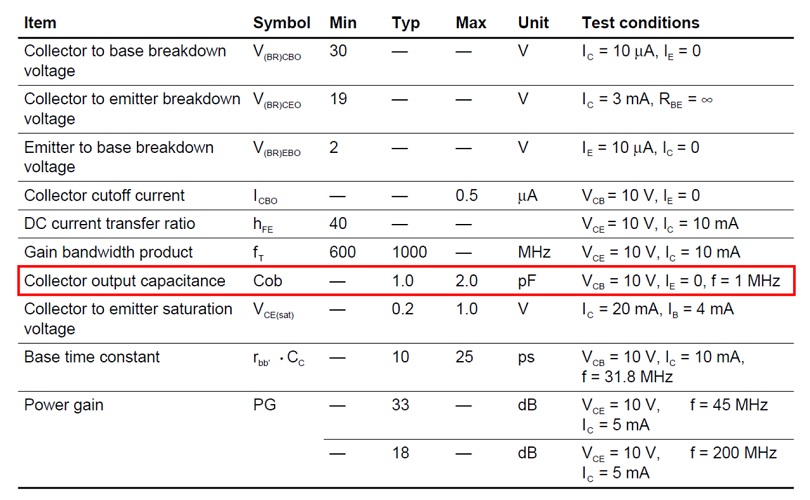
In an amplifier circuit, the collector output capacitance also plays a role.
From the viewpoint of the input signal, the collector output capacitance appears in parallel with the base–emitter capacitance.
And due to the Miller effect, this capacitance effectively becomes multiplied by (1 + gain).
Effective C = Base–Emitter Capacitance + (1 + Gain) × Collector Output Capacitance
This makes the low-pass filtering effect much stronger, reducing the high-frequency response.
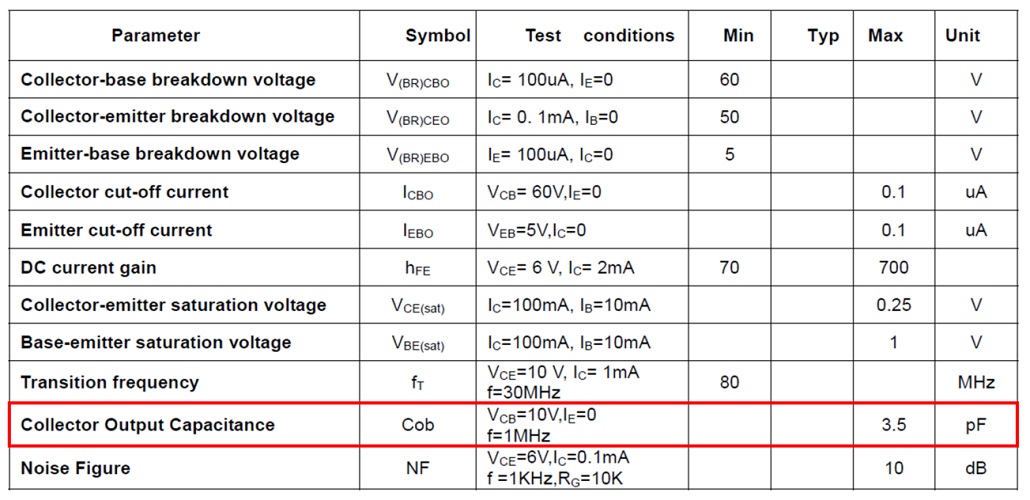
To minimize this effect, choose transistors with a smaller collector output capacitance.
【2SC1815】
【2SC1906】
Let’s Measure the Frequency Response!
Let’s observe how the frequency response of a transistor amplifier changes as the input frequency increases.
By actually building the circuit yourself, you can clearly understand how the amplification varies.
Example Circuit
This is the simplest type of transistor amplifier — a fixed-bias amplifier.
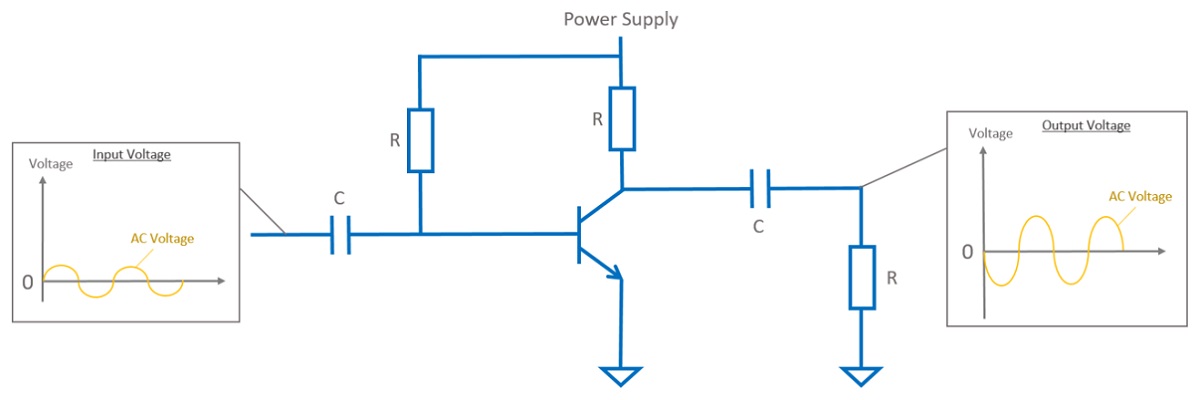
By changing the frequency of the input signal and measuring the output voltage,
you can check how the transistor’s amplification varies.
Low-frequency region:
As you increase the input frequency → the output voltage gradually increases.
Mid-frequency region:
As you increase the input frequency → the output voltage remains stable.
High-frequency region:
As you increase the input frequency → the output voltage gradually decreases.
Even with a simple fixed-bias amplifier, you can clearly observe its frequency characteristics.
Components You’ll Need
Here are the components required to build a fixed-bias amplifier circuit on a breadboard.
- NPN Transistor: 2N3904
-
A classic small-signal transistor.
Perfect for basic amplification experiments. - Resistor Set
-
Having a wide range of resistors helps avoid buying individual values each time.
For basic experiments, 1/4W resistors are sufficient, but for higher-current circuits, use 1/2W or more. - Electrolytic Capacitor Set
-
Used for input and output coupling capacitors.
Like resistors, having many capacitance values is convenient. - Breadboard (830 holes)
-
A solderless breadboard makes it easy to assemble circuits.
Useful when testing different resistor and capacitor values. - Jumper Wire Set
-
Wires for connecting components on the breadboard.
It’s convenient to have both male–male and male–female wires. - USB 5 V Breadboard Power Module
-
Plugs directly into a breadboard and supplies 5 V or 3.3 V.
Very convenient for quick experiments. - Digital Multimeter
-
Used to measure input/output voltages and observe changes in gain.
Works well together with a function generator. - Function Generator
-
Although inexpensive models cannot output very high frequencies,
Here are some models that are easy for beginners to use:
- FG-100 DDS Function Generator (1 Hz – 500 kHz)
- FNIRSI Handheld Function Generator (with waveform display)
- XR2206 Signal Generator Kit (for DIY enthusiasts)
We recommend starting with the FG-100, as it’s simple to operate and very beginner-friendly.
Important Notes
Transistor pin layouts vary depending on the model and manufacturer.
Also, the maximum voltage and current ratings differ by product.
Always check the datasheet before connecting components to ensure correct pin assignment and safe operation.
Useful Tools for Measurement
If you want to observe both the input and output voltages as waveforms, using an oscilloscope is highly recommended.
- To easily check voltage and current: → Digital Multimeter
- To observe signal waveforms: → Oscilloscope
- To power your circuit safely with a stable source: → DC Power Supply
Summary
In this article, we explained the frequency response of transistors.
As the input signal frequency increases, the current gain hfe gradually decreases.
When hfe becomes too small, the transistor can no longer function effectively as an amplifying device, so be sure to keep this in mind when designing circuits.
That’s all for this topic.